Enineering Fundamentals: Stress strain curve
Table of Contents
What is the stress strain curve?
The stress strain curve of a material shows the relationship between its stress and strain. It is obtained through the tensile test of a material, by applying a tensile force to the material and measuring the strain as the force increases.
The stress strain curve is used to determine the mechanic properties of a material, such as the Young’s Modulus, yield strength, ultimate tensile strength and ductility.
The stress curve is plotted from the results of a tensile test.
A tensile stress is applied to the material and the material response (elongation and stretched length) is recorded. The test is conducted with a universal testing machine. The strength of the material determines how much it elongates in the machine.
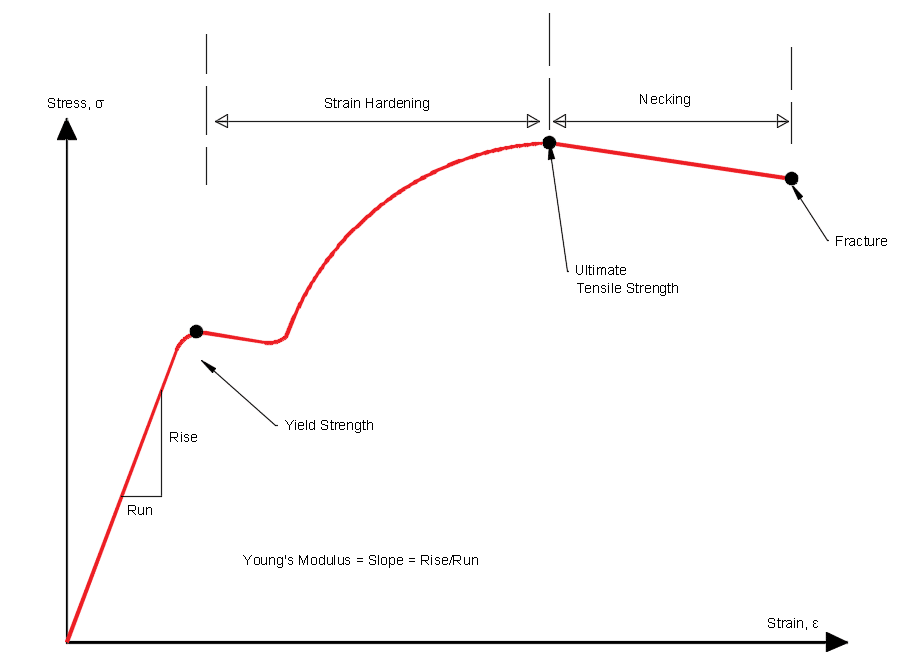
The stress strain curve is shown below:

The Elastic limit – This is the limit where the material elongates/stretches. The stress in this phase does not result in the permanent deformation of the material. The material remains elastic, and will return to its original length when you remove the load.
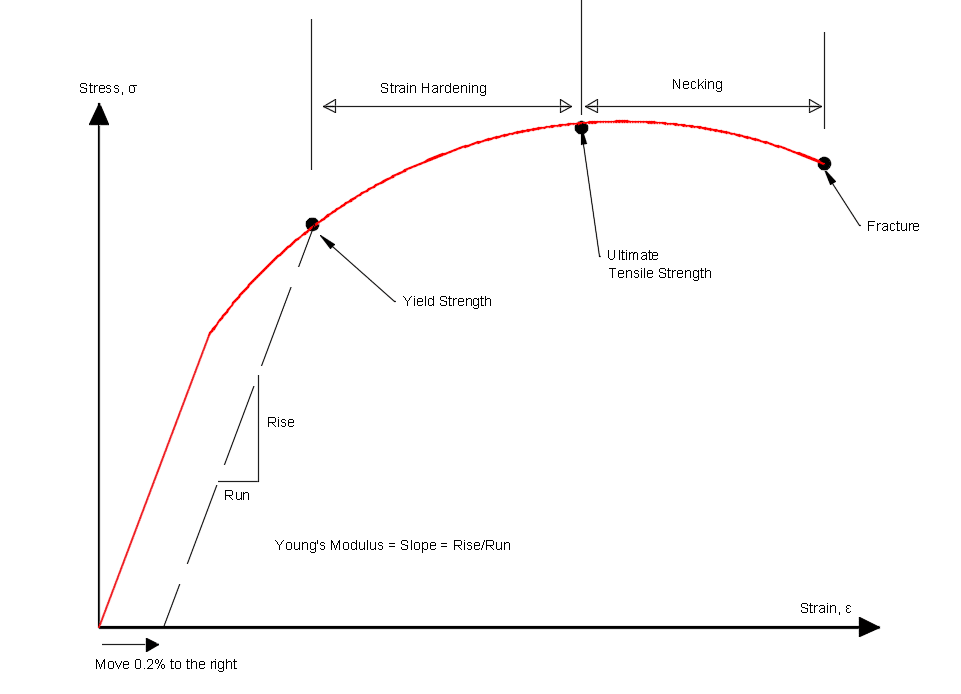
0.2% Proof Stress – The proof strength is the maximum stress that can be induced in a test specimen without causing more than a specified permanent strain.
Young’s Modulus – This is the measured gradient of the slope of the elastic region of the stress strain curve. The elastic region is usually a straight line for the majority of materials. Hooke’s Law states that the relationship between strain and stress in the region is defined as \(\sigma = E\varepsilon\) and is rearranged as \(E = \frac{\sigma}{\varepsilon}\).
The yield Strength- This is the point where the strain begins to increase rapidly and is denoted by \(\sigma_{ys}\) or UYP (upper yield point). It is at this point the material starts to deform plastically and any further stress applied after this point means the material will not return to its original shape (permanent deformation).
Ultimate Yield Strength- The ultimate yield strength/ ultimate tensile strength and is denoted by \(\sigma_{uts}\). It is the maximum stress that the material can withstand during the tensile test.
The Fracture Point- This is the point where the material breaks/factures into 2 pieces.
How do we determine the Yield point with no defined point on the stress strain curve?
This yield point can be determined by taking the 0.2% proof stress.
Practically, this means determine the Young’s modulus of the material (gradient of elastic part of the stress curve) and plotting the gradient and then shifting it over 0.2% to the right on the stress strain curve.

What is engineering stress?
What is Stress?
Stress is the force per unit area and is defined by the equation below
\(\sigma\) = F/A
\(\sigma\) is the tensile stress (force per unit area) with units usually given as N/m2, Ib/in2 or psi)
where F is the applied force (tension) with units in kN or Newtons
A is the cross-sectional area, with units in m2 or in2
Stress can be defined through the various cases below:
- Tensile Stress – Stress that causes tension and stretches/lengths the material – a good example is a steel member brace which is being pulled (i.e, it will starts to lengthen)
- Compressive stress – Stress that compresses/shortens the material – an example is a column under large axial loads (also called axial column shortening)
- Shear Stress – Stress that shears the material – it acts in a plane right angled to the compressible and tensile stress – a good example is a concrete beam under loading and shear cracks begin to form at 45 degrees to the support and applied load.
What is engineering strain?
Strain is the deformation of an object due to tensile stress over the original length of the object. It is a dimensionless unit. The strain formula expresses the value as a ratio between the change in length \(\Delta L\) of a substance over the initial length/dimension \( L\).
The strain equation is shown below:
\(\varepsilon =\Delta L/L_0\)
\(\varepsilon\) = strain (m/m or in/in)
\(\Delta L\) = Elongation/deformation of object (units in m or in)
\(L_o\) is the original length of the object (units in m or in)
What is Necking?
When a material begins to plastically deform under a tensile test, the strain rapdily increases with increases stress. The material cross-section starts to narrow and thin, which is known as “necking”. When the applied stress is large enough, the material begins to neck at the weakest point.
Necking occurs at the point of when the ultimate tensile strength is reached and the graph shows the strain increasing with decreasing stress applied until fracture.
The intimate tensile strength of a material shows engineers the maximum amount of load that can be applied before necking occurs.
Strain Hardening Region of Stress curve
Strain hardening (also known as work hardening), is the strengthening of a metal during plastic deformation. Once the material reaches its yield point and enters the plastic deformation region, the material begins to strain harden, which increases the strength of the material.
This occurs for only some metals and polymers, which depends on the molecular buildup of the material. If we consider a steel material, the atoms are arranged in a rectangular, defect free pattern/shape. As the tensile stress increases, and the metal enters the work hardening phase of plastic deformation, dislocations begins to appear (bonds weaken and break apart).
The increase in dislocations (imagine atoms and molecules squashed and packed against each other) begins to resist the tensile stress. This formation and increase resistance to stress is known as “strain hardening”.
In the stress strain curve, strain hardening occurs after the yield strength of a material has been determined and continues until the ultimate yield strength is achieved, before necking occurs.
Elastic and Plastic Strain
As mentioned previously, elastic strain refers to a the strain in a material, caused by an applied load and the material goes back to its original shape once the load is removed. However the plastic strain occurs once the material has been loaded beyond the elastic limit. Any deformation in that area will remain once the load is removed.
The elastic strain formula is: \(\varepsilon_e = \sigma/E\)
The plastic strain formula is: \(\varepsilon_p = \varepsilon – \varepsilon_e\)
What is True stress and strain?
When we look look at the engineering stress strain curve graphically, it is only an approximation. It does not plot the actual stress and stress that’s recorded during the tensile test.
We have identified that stress equation is defined as \(\sigma_e = \frac{F}{A_o}\) and the strain formula as \(\varepsilon_e = \frac{\Delta L}{L_o}\)
where \(A_o\) is the initial cross sectional area and \(L_o\) is the initial length.
In reality, the cross-sectional area of the material under tensile stress reduces (i.e, the original area is not constant in reality) as the stress increases. However, it is extremely difficult to measure the changing cross-sectional area as the stress increases.
The true stress is calculated from using the actual cross sectional area (area decreases as load increases) at each instance throughout the tensile test. This results in a true stress that is higher than the engineering stress.
The same concept is considered for the strain of the material. The original length of the material is continuously changing throughout the tensile test. The true strain can be calculating by splitting the tensile test into a series of increments of the lengths.
At each stage of the tensile test, the strain is calculated from its new original length. The series of increments are added together to calculate the true strain. Instead of producing a long mathematical addition with lots of small increments, we can use integration of the formula to determine the true strain. For ease, the true stress and true strain formula’s are shown below without the derivation.
The true strain formula is defined as the following:
\(\varepsilon_t = ln(1+\varepsilon_e)\)
The true stress equation is defined as the following:
\(\sigma_t = \sigma_e (1 + \varepsilon_e)\)
The true stress can be derived from making assumptions on the engineering curve. We can assume that the volume remains constant in the stress equation. For ease, the derivation of the equation was not shown above and the true stress equation was given.

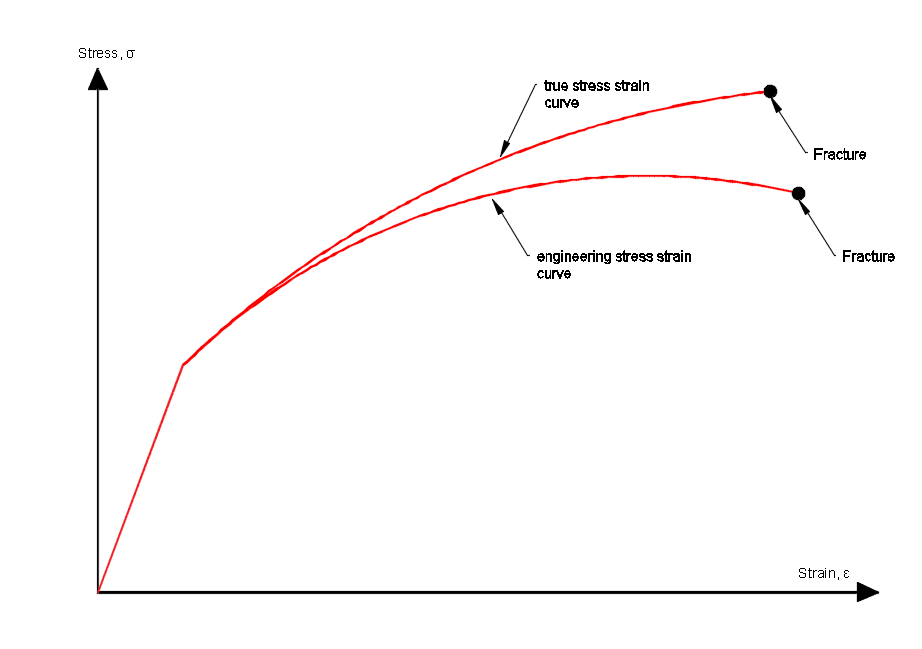
The graph shows the difference between the true stress strain curve and the engineering curve. The difference is apparent where the engineering curve drops and the true curve still increases.
The point at which the engineering curve drops is when the material starts necking (rapid reduction is cross-sectional area) when the material reaches the ultimate tensile strength.
Why do we use engineering stress in design applications instead of true strain?
- Measuring the actual cross-sectional area at each point where the stress is applied/increased is not practical and extremely difficult.
- We often design materials to stay within the elastic region of the engineering stress curve to ensure the material does not permanently deform.
Note – True stress strain curves and values are often used in Finite Element Analysis (FEA models).
Ductile and Brittle Materials
Material ductility can be defined as the ability of a material, which can sustain plastic formation under tensile stress before failure.
Some materials are ductile and can withstand a large amount of plastic deformation, which can be seen and noted before failure, but this depends on the type of material.
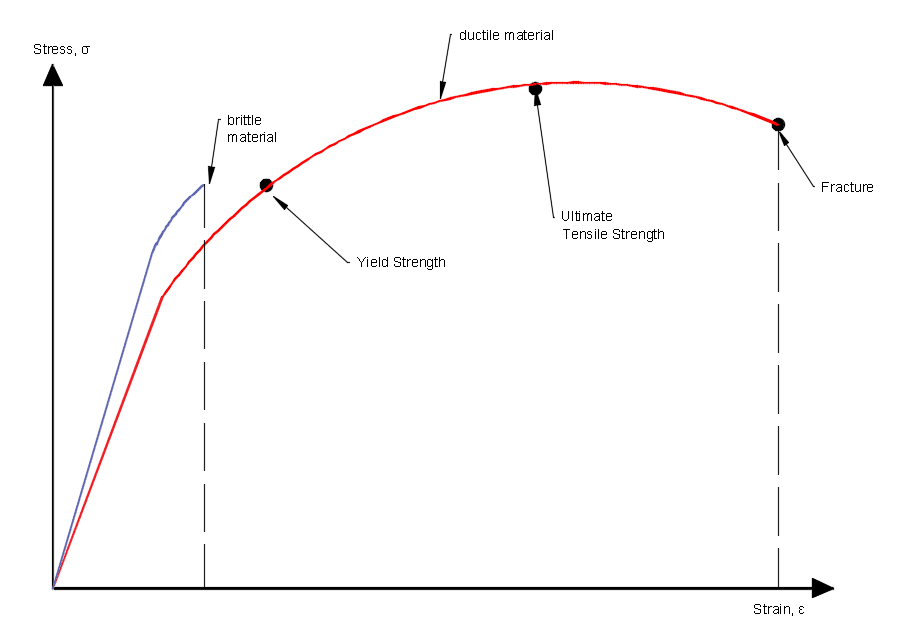
The stress strain curve below shows that ductile materials sustain a large amount of plastic strain before fracturing, which is why they are defined as “ductile”. Examples of ductile materials are steel, mild steel, gold and other metals.
However, materials that fracture with very little to no plastic strain are “brittle”. These materials will fail without any warning and instantaneously fails. Examples of brittle materials are glass and ceramics.
Ductile materials are very useful in industry and the construction of buildings. Steel beams will deflect a large amount which is noticeable and will give occupants and staff of a building to evacuate before failure. However, brittle materials will fail instantly without any warnings, which will result in deaths and injuries for the occupants for structural design elements in building.
The stress strain curve below indicates the points at ductile and brittle materials fail. The graph shows how there is little plastic deformation and the material undergoes a small strain before fracture.

Example 1: Calculate stress in steel section
Determine the engineering stress in a 3.4m steel rod which is 25mm diameter and is subjected to a tensile load of 100 kN. The Young’s Modulus, E, is 210 GPa.
Note – change 100 kN to Newtons by multiplying by 1000. Also, units of MPa is N/mm2
The stress formula is \(\sigma = P/A\)
= 100,000 / (π/4 (25)2)
= 204 MPa
Example 2: Calculate stain in steel section
Determine the normal strain in a 3.4m steel rod which is 25mm diameter and is subjected to a tensile load of 100 kN. The Young’s Modulus, E, is 210 GPa.
Note – change 210 GPa to MPa by multiplying by 1000. Also, units of MPa is N/mm2
The strain formula is \(\varepsilon = \sigma/E\)
= 204 / 210,000
= 0.000971
= 0.0971%
Example 3: Determine the length of Elongation of the Steel section
Determine the length the 3.4m steel rod has stretched under a tensile load of 100 kN. The Young’s Modulus, E, is 210 GPa. The diameter of the rod is 25mm.
The strain formula can be rearranged to the following is \(\varepsilon = \Delta L/L\)
Therefore, \(\Delta L = \varepsilon L\)
= 0.000971 x 3400 mm
= 3.30mm
The section has stretched by 3.3mm.
